Just a Car Crash Away: Cities with the Most Accidents
Despite reductions in driving in the early stages of the pandemic, driving levels are back to normal across the country. This also means that the risk of getting into an accident is now higher.
Public transit use has declined significantly during the pandemic, but drivers have been on the roads in full force again since June. Many have also been behaving more recklessly on the road during the pandemic than before, resulting in a higher share of car accidents. As a result, the rate of fatal crashes has climbed between the first and second quarter of 2020, from 1.10 to 1.42 deaths per million vehicle miles traveled, according to the National Highway Traffic Safety Administration (NHTSA).
In addition to the potentially fatal risks of being involved in a motor vehicle accident and any ensuing property damage, accident-prone drivers also face the possibility of a hike in car insurance costs or a suspended license. Each time a driver gets on the road, they risk being involved in a car crash, no matter how slim the chances seem. It follows that the more vehicle miles traveled, the more likely a driver is to be involved in an accident – and in 2020, that susceptibility is higher, due to the increase in dangerous behavior on the roads.
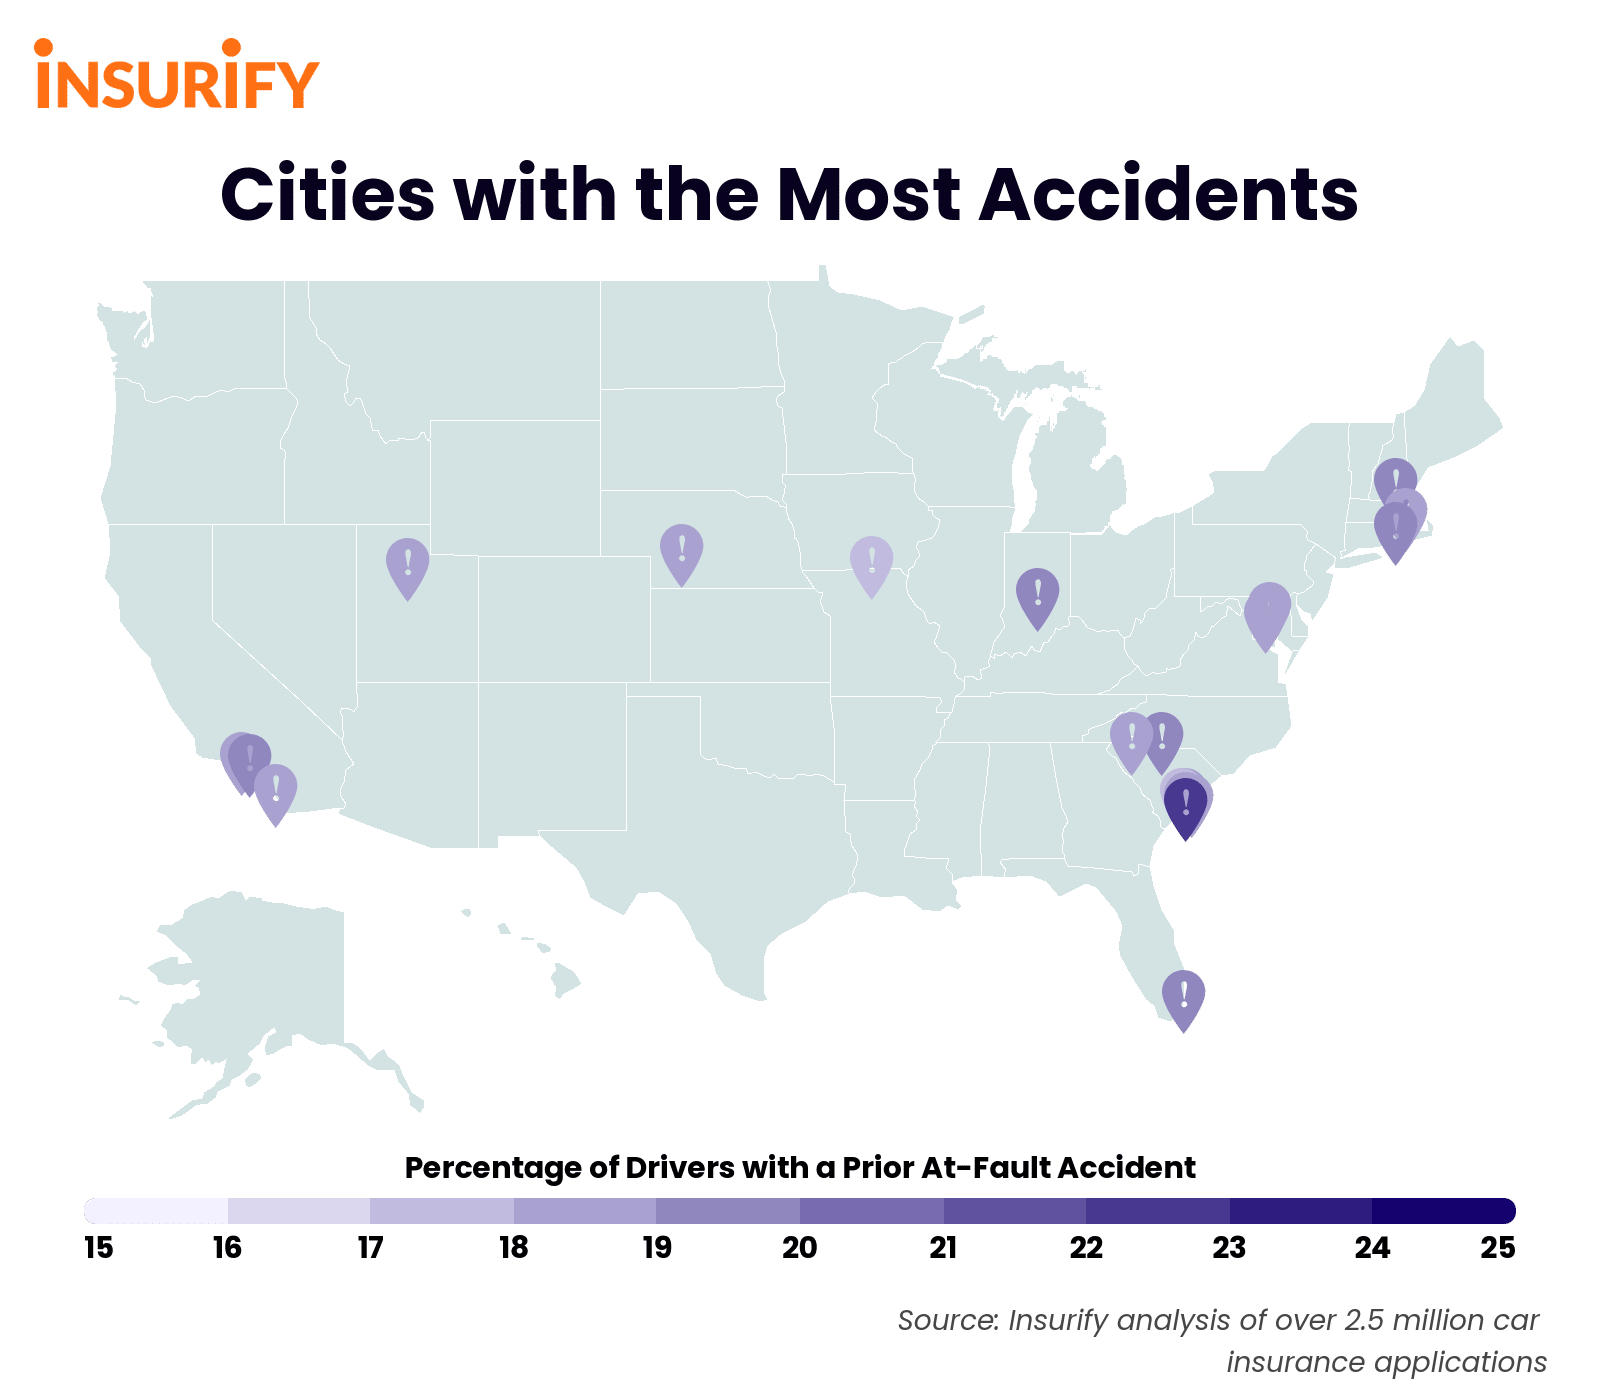
Certain cities seem to be home to a greater share of accident-prone drivers. To identify the cities with the most accidents, the data science team at Insurify referred to their database of over 2.5 million car insurance applications.
Insights
- National averages. Across all U.S. cities, 12.40 percent of motorists have an at-fault accident on their record. Compared to the national average, the 20 cities with the most accidents have at least 40 percent more accident-prone drivers than the national average.
- Perils in the Palmetto State. A whopping 7 out of the 20 cities with the most accidents are located in South Carolina, while 3 are located in California and 2 are located in Maryland. The remaining cities on the list are each located in a different state, from Utah to New Hampshire.
- Minor regional differences. Rates of accident-prone drivers across the four Census Bureau designated regions are virtually the same. 12.75 percent of drivers in the West have an at-fault accident on their record, the highest share out of the four regions. The Midwest has the lowest share of drivers with an at-fault accident on their record, at only 11.18 percent. The Northeast and South fall in the middle, with 12.71 and 12.43 percent of drivers reporting an at-fault accident on their record, respectively. These minor differences between regions are not statistically significant: Insurify’s data science team conducted an analysis of variance on rates of accident-prone drivers in these four regions and found no significant difference between them.
Methodology
To determine the cities with the highest share of accident-prone drivers, the data science team at Insurify referred to their database of over 2.5 million insurance applications. Applicants disclose information regarding their driving record such as whether they have been found at-fault in an accident. For each city, Insurify’s data scientists calculated the proportion of drivers with one or more at-fault accidents on their record. The twenty cities with the highest proportion of those drivers were identified as the cities with the most accidents.
Relative driving levels for each city, compared to January 2020, were gathered from Apple Maps’ Covid Mobility Data as of November 13, 2020.

20 Cities with the Most Car Accidents
20. Murfreesboro, Tennessee
- Percentage of drivers with a prior at-fault accident: 17.32%
- Driving levels compared to January 2020: +25%
19. Cincinnati, Ohio
- Percentage of drivers with a prior at-fault accident: 17.38%
- Driving levels compared to January 2020: +29%
18. Spartanburg, South Carolina
- Percentage of drivers with a prior at-fault accident: 17.42%
- Driving levels compared to January 2020 (Spartanburg County): +24%
17. Buffalo, New York
- Percentage of drivers with a prior at-fault accident: 17.48%
- Driving levels compared to January 2020: +3%
16. Summerville, South Carolina
- Percentage of drivers with a prior at-fault accident: 17.50%
- Driving levels compared to January 2020 (Dorchester County): +21%
15. Bowie, Maryland
- Percentage of drivers with a prior at-fault accident: 17.59%
- Driving levels compared to January 2020 (George’s County): +24%
14. Lincoln, Nebraska
- Percentage of drivers with a prior at-fault accident: 17.73%
- Driving levels compared to January 2020: +2%
13. Greer, South Carolina
- Percentage of drivers with a prior at-fault accident: 17.83%
- Driving levels compared to January 2020 (Greenville County): +26%
12. Charleston, South Carolina
- Percentage of drivers with a prior at-fault accident: 18.06%
- Driving levels compared to January 2020: +10%
11. South Jordan, Utah
- Percentage of drivers with a prior at-fault accident: 18.12%
- Driving levels compared to January 2020 (Salt Lake County): +1%
10. Goose Creek, South Carolina
- Percentage of drivers with a prior at-fault accident: 18.14%
- Driving levels compared to January 2020 (Berkeley County): +17%
9. Simi Valley, California
- Percentage of drivers with a prior at-fault accident: 18.17%
- Driving levels compared to January 2020 (Ventura County): +1%
8. Carlsbad, California
- Percentage of drivers with a prior at-fault accident: 18.27%
- Driving levels compared to January 2020 (San Diego County): -6%
7. Brockton, Massachusetts
- Percentage of drivers with a prior at-fault accident: 18.61%
- Driving levels compared to January 2020 (Plymouth County): +20%
6. Sherman Oaks, California
- Percentage of drivers with a prior at-fault accident: 18.68%
- Driving levels compared to January 2020 (Los Angeles County): +3%
5. Rock Hill, South Carolina
- Percentage of drivers with a prior at-fault accident: 18.70%
- Driving levels compared to January 2020 (York County): +38%
4. Greenwood, Indiana
- Percentage of drivers with a prior at-fault accident: 18.74%
- Driving levels compared to January 2020: +45%
3. Manchester, New Hampshire
- Percentage of drivers with a prior at-fault accident: 19.21%
- Driving levels compared to January 2020: +31%
2. Warwick, Rhode Island
- Percentage of drivers with a prior at-fault accident: 19.43%
- Driving levels compared to January 2020: +25%
1. Johns Island, South Carolina
- Percentage of drivers with a prior at-fault accident: 21.6%
- Driving levels compared to January 2020 (Charleston County): +36%
If you have questions or comments about this article, please contact insights@insurify.com.
More From 96.7 The Eagle